We would like to thank everyone who joined the presentation of our initial results at the RAC 2021 virtual conference. The PDF version of the Power Point Slide deck is available below for any you wish to have another look. A video of the presentation has been posted to the Radio Amateurs of Canada YouTube channel. The direct link is here.
The objective of our 60M propagation experiment is to evaluate the band as a viable HF communications link between remote communities and larger centers throughout the Northern Canada Auroral Zone.
To accomplish this, a number volunteer Amateur Radio operators setup automatic beacons for during the data collection portion of the project that lasted from late 2016 until the end of 2020.
We used the PSK Reporter to collect beacon reports until 2020 when we started using js8call and a custom script that would parse the log files and insert the reports into our database server.
Solar weather data was collected from various government and scientific organizations and inserted into our central database every 15 minutes.
We are now in the data analysis phase of the project with 170,000+ receive beacon reports. Watch this site for updates on our results.
During the presentation we gave to the 2021 RAC Virtual Conference on the 60m propagation study the question came up if we had compared our results against other HF bands. At the time we hadn’t as it wasn’t feasible to have multi-band Olivia or JS8call beacons on enough stations to really analyze the differences between different bands such as 40m, 60m, and 80m. Like most other projects in Amateur Radio our project is 100% volunteer and we just didn’t have the resources.
Ron VE8RT in Yellow Knife had setup a WSPR beacon on 60m in the summer of 2021, and had asked a number of Amateur Radio Operators to listen for his beacons. Since we had shut down the active data collection portion of the 60m propagation study, Sean VE6SAR and Al VE6RFM(SK) both setup their stations to monitor. Ron was beaconing with less then 200mw and being heard consistently in Peace River and Ft. McMurray.
While looking at data from wsprnet.org Sean realized that the historical wspr beacon data going back as far as 2008 was available for download in .csv format. This gave us the ability to compare various bands without having to maintain many active multi-band beacons in order to gather data. Now the WSPR mode is outside the original parameters of the 60m propagation study as it’s not used for 2 way communications. It was designed to test propagation which is exactly what we were looking for to compare 60m with other bands.
Now that we had figured out where to get beacon information, we started to build the data pipeline to download the data from the wsprnet.org website and distill it into a usable dataset for our purposes. Each months data file is over 2GB compressed and contains millions of beacon reports for all armateur bands. We are only concerned with the three bands that are usually used for NVIS propagation 40m, 60m, 80m and for interest sake 160m.
When we filtered the data to insert it into the our database the criteria the script uses is first looks to see if either the sender or receiver are located north of 49 degrees. 49 degrees was choose because the WSPR report locations use the Maidenhead Grid System so it was convenient to filter locators with the second character of O – R to get the stations in the northern Auroral Zone. Then as we are interested primarily in NVIS communications, only beacon reports where the distance between the sender and receiver were less then 1000 Km (620 Miles).
Since we already have a relatively complete record of solar conditions from January 2017 on, we imported WSPR data starting with January 2017.
As of Mid-November 2022 in our database we have the following numbers of reports:
40 Meters – 327,819,966 Records
60 Meters – 21,406,699 Records
80 Meters – 82,933,539 Records
160 Meters – 26,466,234 Records
Total Records – 458,626,438 Records
We finally have the records loaded into the database and are adding new records the first of every month after the wsprnet.org database dump in uploaded to their site.
So far we’ve only had a really high level first look at the data, as you can imagine crunching through almost a half million records takes awhile.
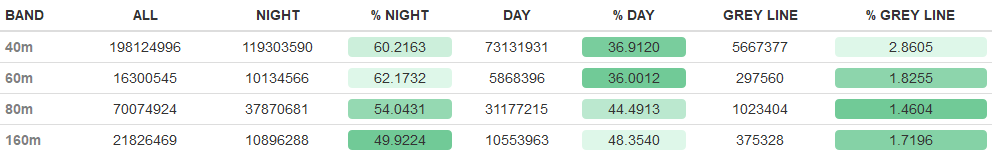
First let’s start with some totals by band.
You will note that the lower the frequency the less difference between the number of night and day reports, this could indicate that the time of day has less effect on the lower bands, or stations are more likely to leave their beacons on 24/7.
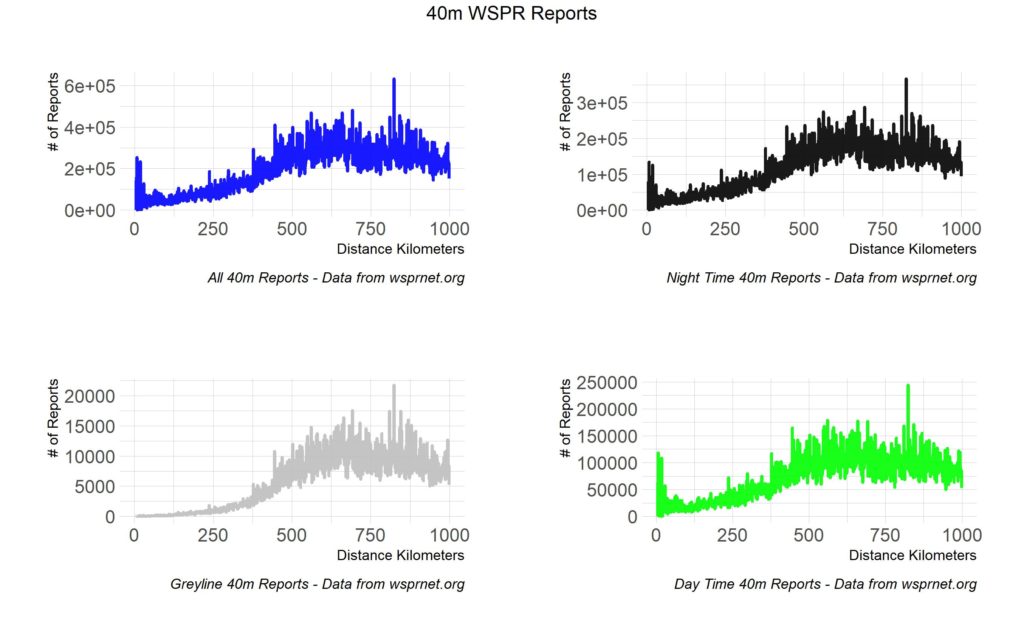
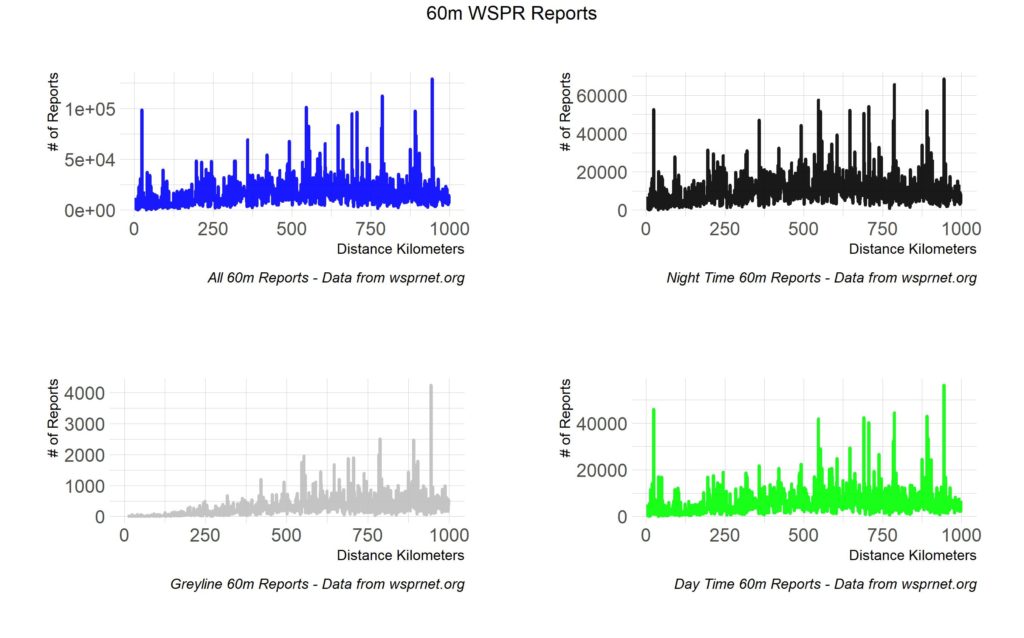
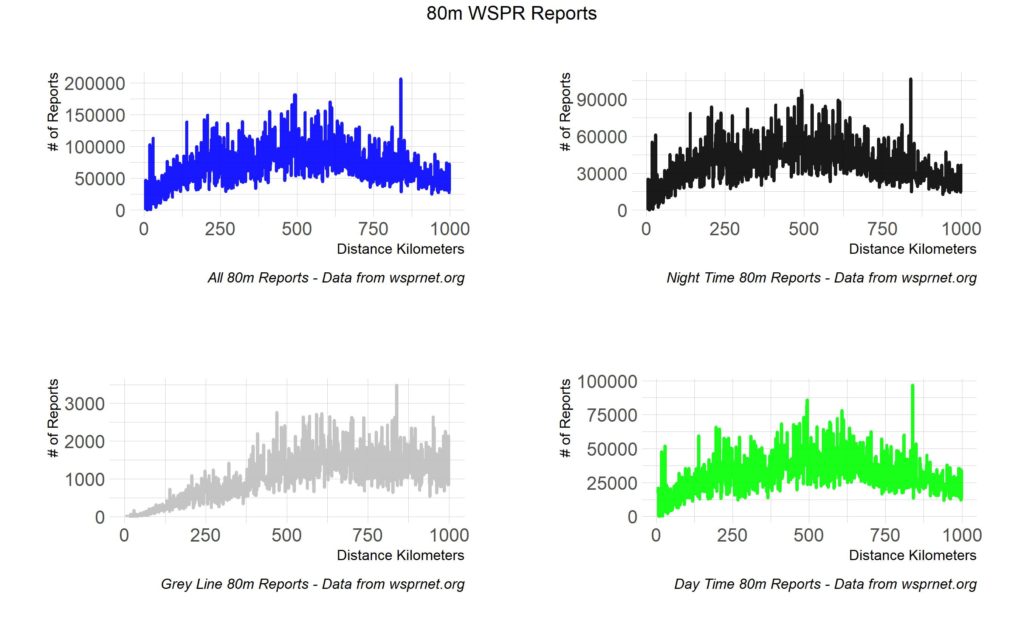
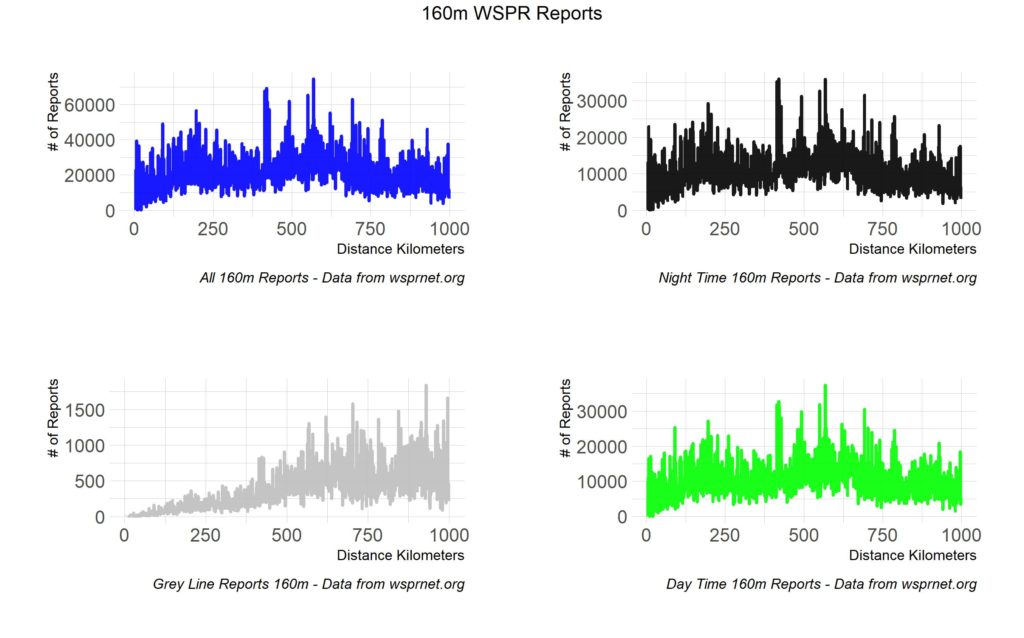
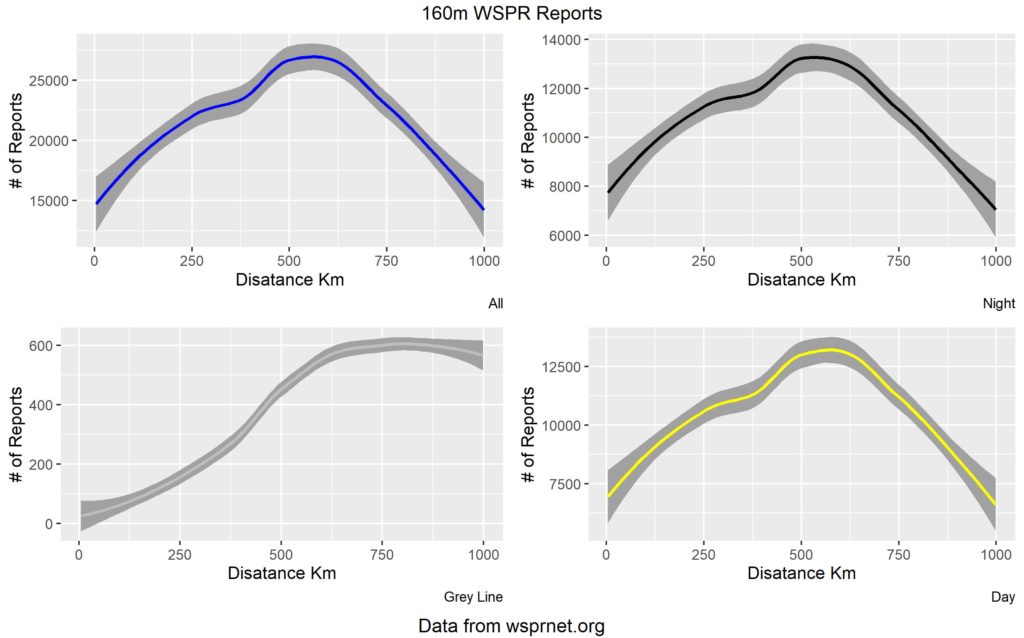
The next set of data we determined how many reports were received at each distance from 1 Km – 1000 Km then generated the following rought line graphs.
Number of 40m Reports by DistanceNumber of 60m Reports by DistanceNumber of 80m Reports by DistanceNumber of 160m Reports by Distance
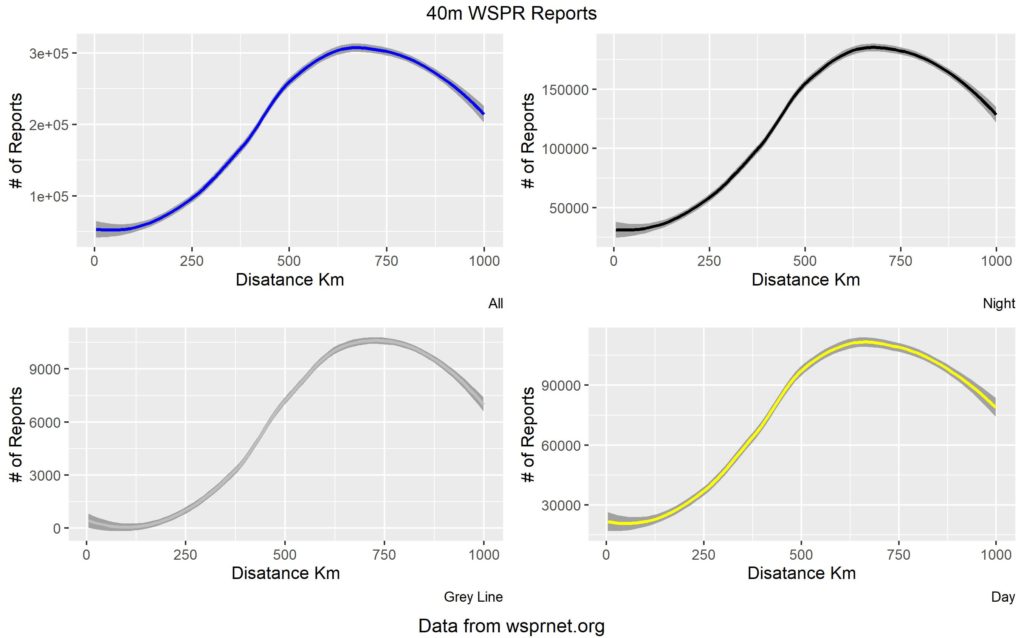
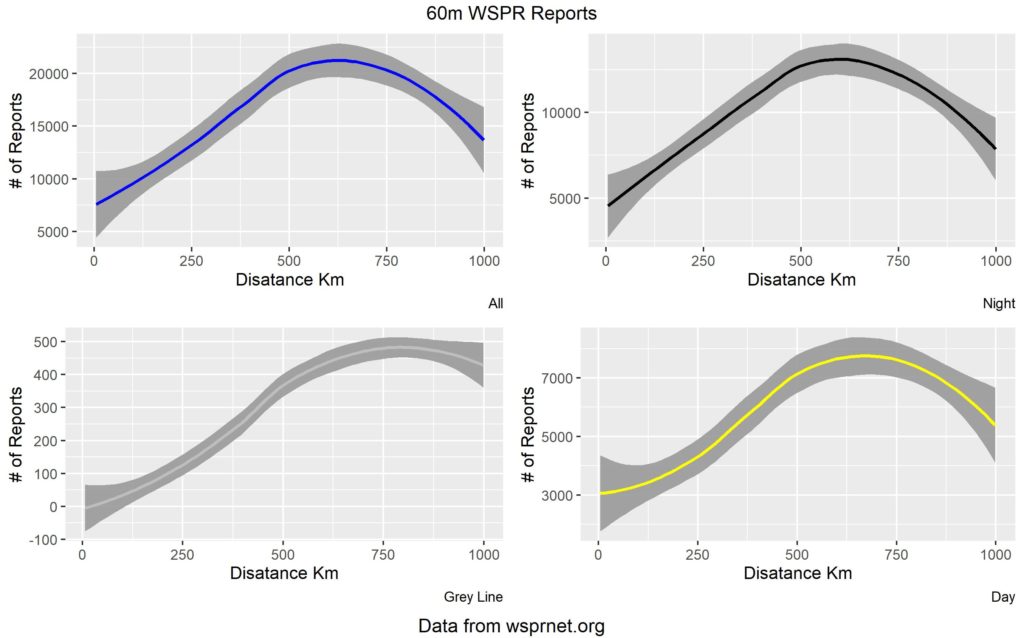
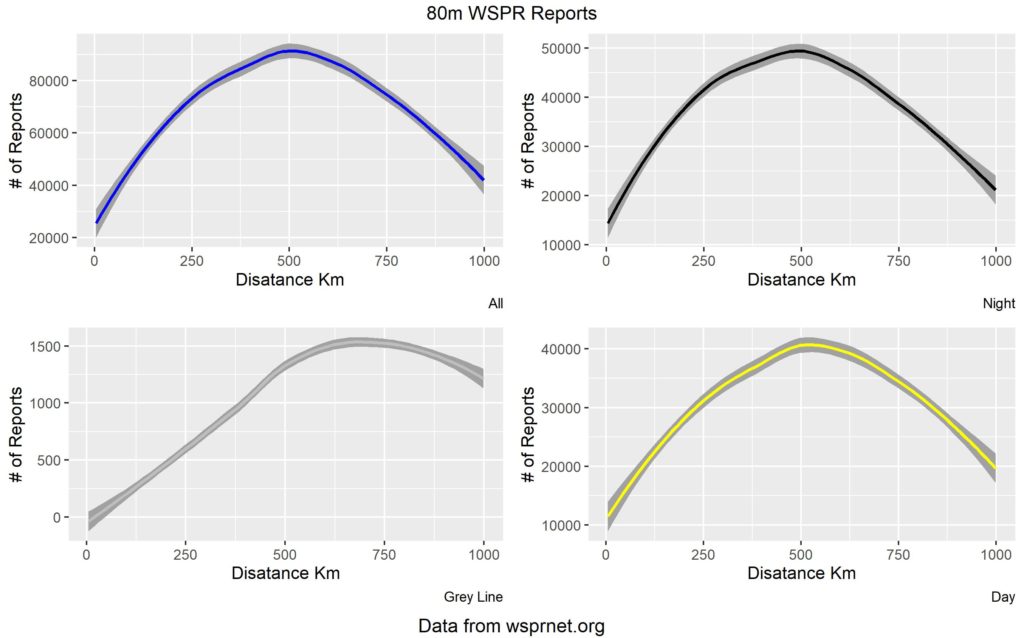
Here is the same data with smoothing applied to give a better representation of where each band favors.
Based solely on this data 60m and 80m are the most consistent for NVIS, it will be interesting to see how they look once we factor in solar data.
As time allows we will get more analysis done and post it on this site.
Since 2016, we’ve used a few differenet tools to gather and analyze the data for the is project. Some where produced by the Amateur Radio Community others we built is house.
The above scripts are both written in Perl which makes them platform independent. Perl can be installed on any major operating system. They have been posted as an example for others to use in creating their own scripts.